

Slope of Hope Blog Posts

Slope initially began as a blog, so this is where most of the website’s content resides. Here we have tens of thousands of posts dating back over a decade. These are listed in reverse chronological order. Click on any category icon below to see posts tagged with that particular subject, or click on a word in the category cloud on the right side of the screen for more specific choices.

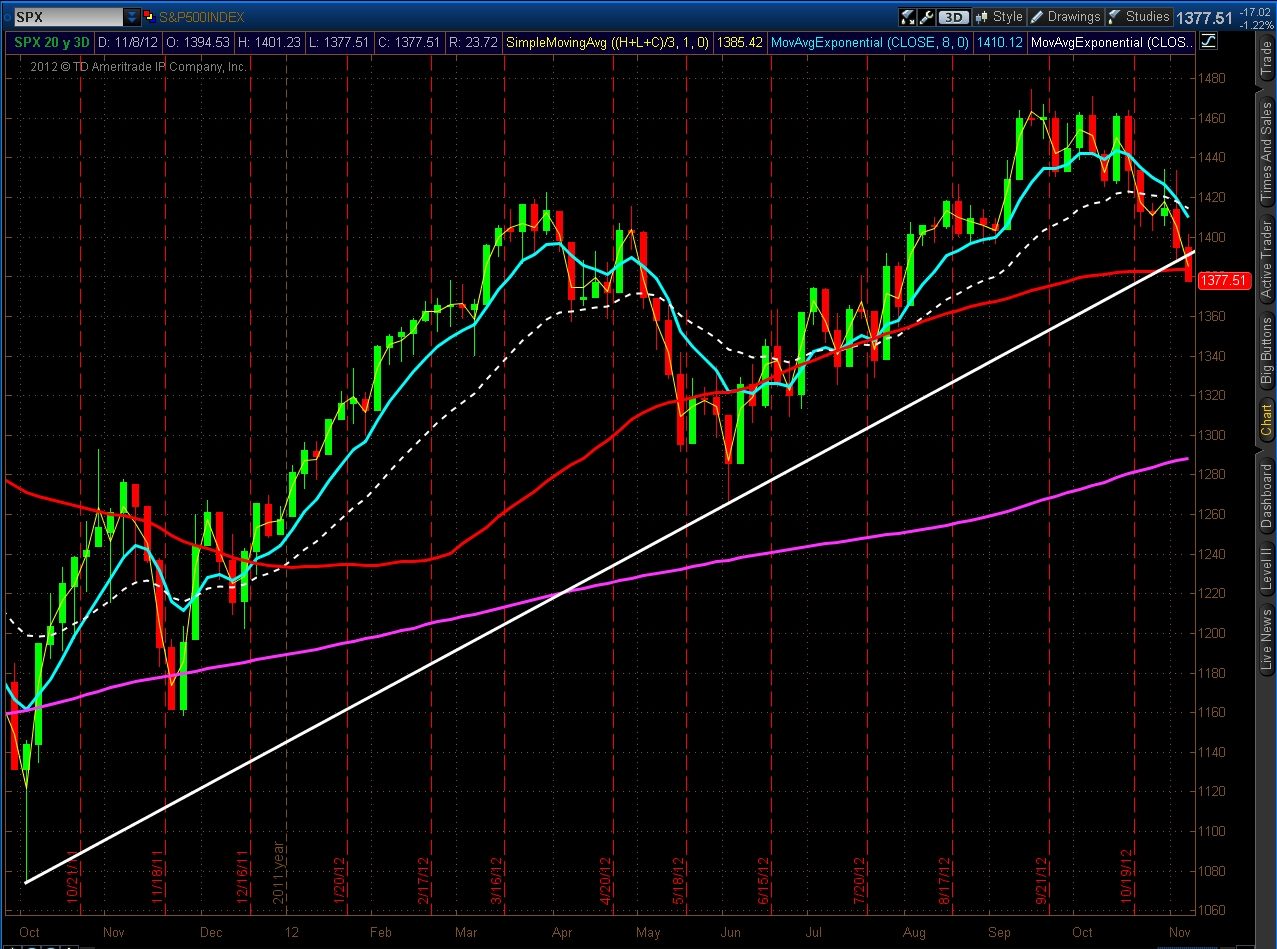
Bearish Trendline Break on the S&P 500 Index (by SB)

By -

Following on the heels of yesterday's bearish trendline breaks on 6 of the 7 Major
Indices,
the SPX broke and closed below its uptrend line from the October
2011 lows in today's (Thursday's) price action, as shown on the chart below.
Note that each candle represents three (3) days on this chart.

All seven Major Indices have now broken and closed below this major
uptrend line in what could be a setup for a major move down. Any backtest of and
subsequent failure to break and hold above the respective trendlines would
confirm such a scenario. Of course, we may see continued (and even accelerated)
weakness from here, which could send the related E-mini Futures Indices (YM, ES
& TF) to their respective Head & Shoulders targets of 12400, 1330, and 735, inasmuch
as their necklines have now been broken.
Bearish Trendline Breaks on the Major Indices (by SB)

By -

Each candle on the charts below represents a period of three
days.
The current candle closed today (Wednesday). I wanted to look at
this timeframe on the assumption that the two-day rally (which began on Monday
this week) was simply a pre-election dead-cat bounce, and to see how much lower
today's close was compared to Friday's close. Here are the figures for each of
the Major Indices.

S&P 100 Index

  • Friday's close = 646.88
  • Today's close = 636.27
  • Today's close dropped 10.61 points from Friday's close

Dow 30
Index

  • Friday's close = 13093.16
  • Today's close = 12932.73
  • Today's close dropped 160.43 points from Friday's close

S&P
500 Index

  • Friday's close = 1414.20
  • Today's close = 1394.53
  • Today's close dropped 19.67 points from Friday's close

Nasdaq 100
Index

  • Friday's close = 2656.28
  • Today's close = 2612.69
  • Today's close dropped 43.59 points from Friday's close

Russell
2000 Index

  • Friday's close = 814.37
  • Today's close = 804.52
  • Today's close dropped 9.85 points from Friday's close

Dow
Utilities Index

  • Friday's close = 469.78
  • Today's close = 452.30
  • Today's close dropped 17.48 points from Friday's close

Dow
Transportation Index

  • Friday's close = 5110.17
  • Today's close = 5103.52
  • Today's close dropped 6.65 points from Friday's close

(more…)

Comparing Recent Price Action on the Four Major Indices (by SB)

By -

Below are several charts comparing price action among the Dow 30, S&P 500,
Nasdaq 100, and Russell 2000 Indices.

The first chart shows the price
action over the past three days, beginning with Friday's big decline. With
yesterday's and today's (Tuesday's) combined bounce, the INDU and SPX
have closed higher than Friday's open, while the NDX and RUT are still
below.

The next
chart shows yesterday's and today's bounce. The RUT is leading in terms of
percentage gained over the past two days and is the one to watch to see if this
leadership holds on any further rally, or if meaningful weakness enters that
could, ultimately, drag the others down.

The NDX was the
weakest on the two-day bounce, perhaps because of AAPL's relative weakness,
which is reflected in this year-to-date Daily ratio chart comparing AAPL to the
NDX (the Momentum Indicator is still below zero as price struggles below
resistance)…also, two important ones to watch for either a strengthening or
for further relative weakness, which could lead to the resumption of a decline
in both.