


Earthquake hits NYC, BAC blamed.
After a rare East Coast earthquake shook New York City Tuesday, this was one of a number of tweets I saw blaming the tremor on Bank of America (another suggested what we felt was BAC's implosion).

Slope initially began as a blog, so this is where most of the website’s content resides. Here we have tens of thousands of posts dating back over a decade. These are listed in reverse chronological order. Click on any category icon below to see posts tagged with that particular subject, or click on a word in the category cloud on the right side of the screen for more specific choices.
Earthquake hits NYC, BAC blamed.
After a rare East Coast earthquake shook New York City Tuesday, this was one of a number of tweets I saw blaming the tremor on Bank of America (another suggested what we felt was BAC's implosion).
Hedging when volatility is low
Something I've mentioned in previous posts (such as this one, "Plan not to Panic") is that investors ought to consider hedging when volatility is low, and hedging costs are relatively low as well. That's not the case now, as you can see from the second table below. Nevertheless, if Portfolio Armor downloads and subscriptions are any guide, every day the market tanks, more investors start thinking about hedging. It seems that some long investors start shopping for umbrellas after they get soaked.
Higher vol, higher hedging costs
The Chicago Board Options Exchange Market Volatility Index (VIX) declined 6.77%, to 36.36 on Friday. To illustrate how this level of volatilty affects hedging costs, I've included the two tables below — one showing the hedging costs of a basket of ADRs and ETFs on Friday, August 12, and another showing the hedging costs of the same basket on August 2nd, with the VIX under 25. Before that, though, a quick note of thanks to Tim and my fellow Slopers.
Here comes another lesson
The market crash Monday, coming hot on the heels of the one last Thursday, made me think of the book of dark short stories pictured below (one I think some other Slopers might appreciate), Here Comes Another Lesson. A brief excerpt should illustrate.

This excerpt is from a story called "The Professor of Atheism: Here Comes Another Lesson", in which a failed academic named Charles finds a pair of angel wings that miraculously attach to his body and allow him to fly:
“Hey, Professor!” Charles turns around to see a very short, very wide man stamping and scraping his feet on the cinders. His blunt, wide head is lowered between his mountainous shoulders, and a massive nose ring loops between his snorting nostrils. “Who are you?” asks Charles. “I’m a real angel,” says the main. “Then where are your wings?” “Don’t be stupid! That’s just a cliché.” Even before these words are out of his mouth, the man has begun running toward Charles, ramming his blunt forehead into Charles’s solar plexus and knocking him onto his bewinged back. It is a moment before Charles can catch his breath. He sits up and asks, “What did you do that for?”. “To teach you a lesson”. “What kind of lesson is that?” What other kind of lesson is there?” It is a long time before Charles can think of a response to this one. Finally he asks, “Who sent you?” Who do you think?” “God?” The man laughs. “Satan?” the man laughs even harder. “You know,” he says, “your so pathetic I almost hate to do this.” The man slaps his hands together and begins stamping and shuffling again. “Okay,” he says, “here comes another lesson!”
Three lessons from the market meltdowns
Lesson 1: Diversification Doesn't Protect Against Market Risk
Diversifying among a basket of different stocks reduces stock-specific risk, but not market risk. When the market crashes, nearly all stocks get hammered. That’s what happened on Thursday, as 497 of the stocks in the S&P 500 were down on the day. And that's what happened Monday, when all 500 stocks in the S&P 500 were down on the day.
Lesson 2: Hedging Can Limit Market Risk
The screen shot below shows the performance of the SPDR S&P 500 Trust ETF (SPY), the SPDR Dow Jones Industrial Average ETF (DIA), and a few put options on them that I referred to in my last Slope post. More on the DIA puts below.
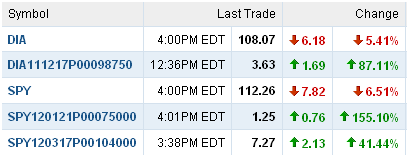
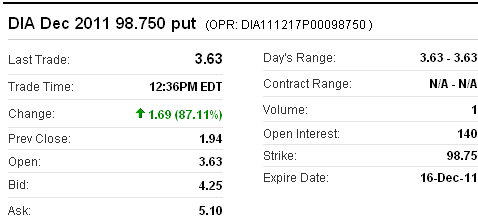
Up 87.11% Monday
This is the $98.75 strike put option on DIA expiring in December, 2011. In recent posts, I've mentioned in the disclosures that I am long puts on DIA as a hedge. Those are the specific DIA puts I own. In late June, I used Portfolio Armor to find the optimal put options to hedge against a greater-than-20% drop in DIA, and those were the ones Portfolio Armor presented. I bought them at $1.28. The screen shot below shows the quote for them as of Thursday, but first a quick reminder about optimal puts.
About Optimal Puts
Optimal puts are the ones that will give you the level of protection you specify at the lowest possible cost. As University of Maine finance professor Dr. Robert Strong, CFA has noted, picking the most economical puts can be a complicated task. With Portfolio Armor (available on the web and as an Apple iOS app), you just enter the symbol of the stock or ETF you're looking to hedge, the number of shares you own, and the maximum decline you're willing to risk (your threshold). Then the app uses an algorithm developed by a finance PhD to sort through and analyze all of the available puts for your position, scanning for the optimal ones.
Lesson 3: Higher Volatility Means Higher Hedging Costs
A point I've made in previous posts (e.g., this one) is that investors ought to consider hedging when volatility is low, and hedging costs are relatively low as well. Below are a few snap shots of hedging costs at different volatility levels that show how quickly volatility can spike and hedging costs can rise.
Hedging costs as of May 9, with the VIX at 17.16
The hedging costs in this table were first posted in this article on May 10.
|
Symbol |
Name |
Cost of Protection (as % of position value) |
|
SPY |
SPDR S&P 500 |
1.77%* |
| DIA | SPDR Dow Jones Industrial Avg | 1.49%* |
| QQQ | PowerShares QQQ Trust | 2.11%* |
Hedging costs as of August 5, with the VIX at 32
|
Symbol |
Name |
Cost of Protection (as % of position value) |
|
SPY |
SPDR S&P 500 |
3.56%** |
| DIA | SPDR Dow Jones Industrial Avg | 3.06%** |
| QQQ | PowerShares QQQ Trust | 3.30%** |
Hedging costs as of August 8, with the VIX at 48
|
Symbol |
Name |
Cost of Protection (as % of position value) |
|
SPY |
SPDR S&P 500 |
5.38%** |
| DIA | SPDR Dow Jones Industrial Avg | 5.23%** |
| QQQ | PowerShares QQQ Trust | 5.83%* |
*Based on optimal puts expiring in December 2011.
**Based on optimal puts expiring in March 2012.
Hedging costs after Thursday's market meltdown
Last week, with the debt ceiling negotiations dragging on, we looked at the costs of hedging a handful of equity index, gold-, Treasury bond-, and dollar index-tracking ETFs. Below is a snap shot showing the current hedging costs of the same basket of ETFs after Thursday's market meltdown. Before that though, a look at how a couple sets of index ETF puts fared during Thursday's market meltdown.
SPY puts
For a Seeking Alpha post Wednesday, I used Portfolio Armor to pull up the optimal puts to hedge against a greater-than-20% drop in SPY over the next several months. Usually, I don't keep track of what the optimal puts are for these articles, I just post the costs. As it happened though, someone asked me what they were, so I made a note of them. They were the $104 strike, March 2012 puts. Here's what happened to them Thursday.
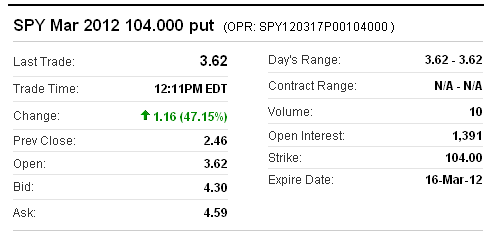
DIA puts
These puts I kept track of because I own them. In late June, I used Portfolio Armor to find the optimal put options to hedge against a greater-than-20% drop in DIA, which turned out to be the $98.75 strike, December puts. Here's what happened to those puts Thursday.
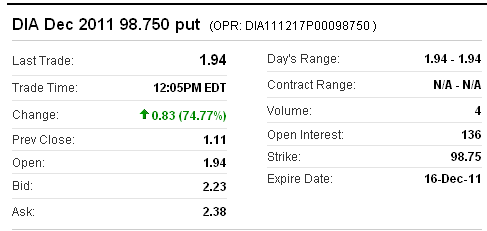
Current hedging costs: an update on last week's table
Hedging against a >30% correction in stocks
The table below shows the costs, as of Thursday's close, of hedging the same 5 equity index ETFs against greater-than-30% corrections over the next several months, using optimal puts.
Current Hedging against a >15% correction in bonds, gold, and the dollar
The table also shows the costs of hedging the same gold-, U.S. dollar-, and Treasury Bond-tracking ETFs against greater-than-15% declines over the next several months using optimal puts. First, a quick reminder about what optimal puts are, and a note about costs.
Optimal puts
Optimal puts are the ones that will give you the level of protection you want at the lowest possible cost. As University of Maine finance professor Dr. Robert Strong, CFA has noted, picking the most economical puts can be a complicated task.
With Portfolio Armor (available on the web, and as an Apple iOS app), you just enter the symbol of the stock or ETF you're looking to hedge, the number of shares you own, and the maximum decline you're willing to risk (your threshold – you can enter any percentage you like, but the larger the percentage, the greater the chance there will be optimal puts available for the position). Then the app uses an algorithm developed by a finance Ph.D. to sort through and analyze all of the available puts for your position, scanning for the optimal ones.
A note about costs
To be conservative, Portfolio Armor calculates hedging costs using the ask price of the optimal puts. In many cases, you may be able to buy the puts for a lower cost (between the bid and the ask prices).
Hedging Costs as of Thursday's Close
|
Symbol |
Name |
Cost of Protecting against >30% Decline, as % of position |
|
Equity Index ETFs |
||
|
QQQ |
PowerShares QQQ Trust |
1.50%* |
|
SPY |
SPDR S&P 500 |
1.78%* |
|
DIA |
SPDR Dow Jones Industrial Avg |
1.61%* |
| EFA | iShares MSCI EAFE Index | 2.65%* |
| EEM | iShares MSCI Emerging Markets | 2.80%* |
| Symbol | Name | Cost of Protecting against a >15% Decline, as % of position |
| U.S Dollar ETF | ||
| UUP | PowerShares DB US Dollar Index | 0.51%* |
| U.S. Treasury Bonds | ||
| TLT | iShares Barclays 20+ Yr Treas | 1.97%* |
|
Gold |
||
|
GLD |
SPDR Gold Trust |
1.77% |
*Based on optimal puts expiring in March, 2012.
